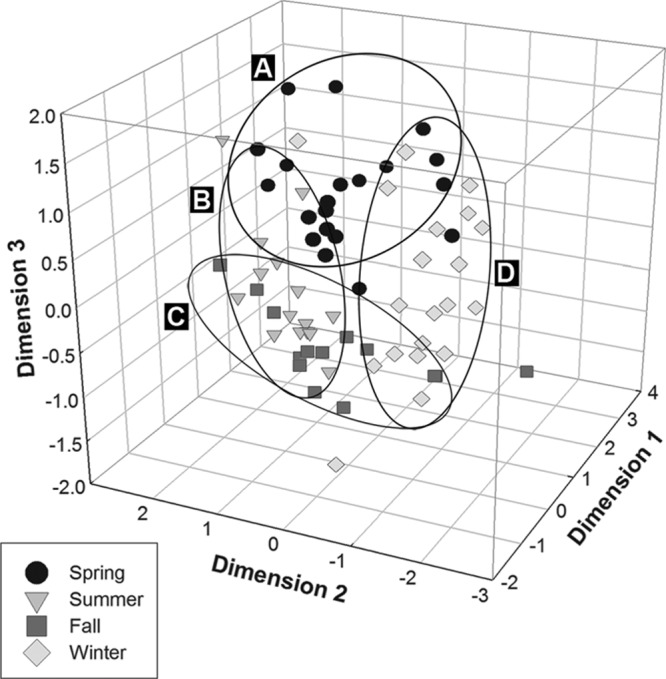
Fig 5.

Nonmetric multidimensional scaling plots of T-RFLP community profiles from river water (stress value of 14), with ellipses A to D encompassing 90% of the respective markers by season. Markers that appear close together are more similar than distant markers.
