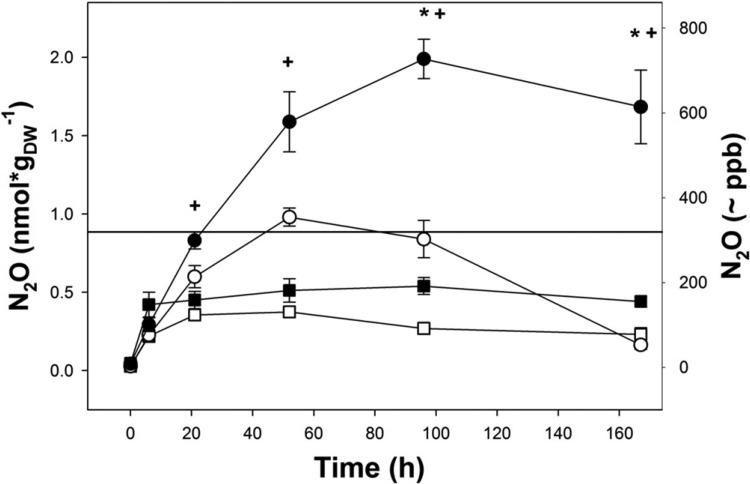
Fig 2.
Production and consumption of N2O by unsupplemented palsa peat soil. Squares and circles represent 0- to 20-cm and below-20-cm palsa peat soils, respectively. Closed and open symbols represent microcosms with and without acetylene, respectively. Mean values and standard errors of three replicates are shown. Time points at which N2O concentrations in below-20-cm soil with acetylene differed significantly (P < 0.05) from N2O concentrations in below-20-cm soil without acetylene (*) or in 0- to 20-cm palsa peat soil with acetylene (+) are indicated. The horizontal line indicates the atmospheric N2O concentration (319 ppb).

