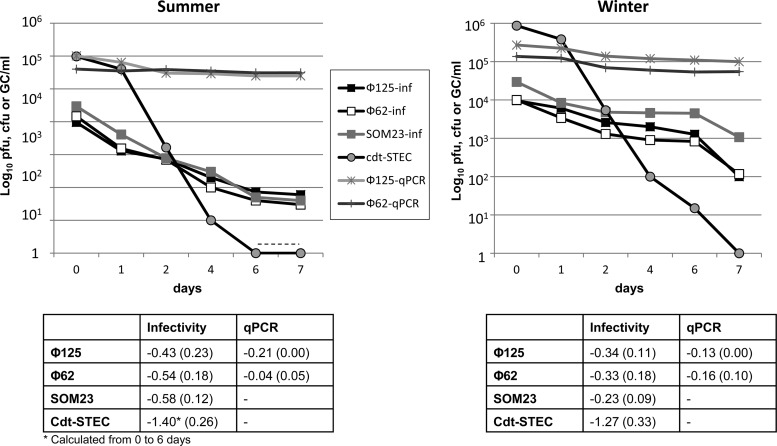
Fig 3.
Persistence of Cdt phages (qPCR and infectivity), SOM23 (plaque assay) and Cdt-STEC (colony counts) to inactivation processes in a mesocosm in summer and winter. Each chart shows the results of one representative experiment in each season. The table presents the averages (SD) of the slopes of the equation of the logarithmic regression lines obtained with three replicas of the experiment. The dotted line indicates values below the limit of detection.

