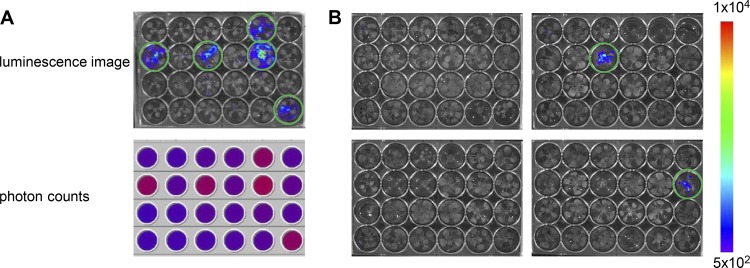
Fig 1.
Detection of photons emitted by the lux-tagged pathogen P. syringae DC3000 on plants. (A) Luminescence image and microplate reader photon counts of a 24-well plate with A. thaliana plants at 3 days postinfection (dpi) with P. syringae DC3000 lx. Plants were seed inoculated with wild-type Sphingomonas sp. Fr1 (unmarked) or kept axenically (marked with a circle on the luminescence image) prior to P. syringae DC3000 lx application. The photon counts (cps) measured with the microplate reader were converted to a color image, where red indicates high values and blue low values. (B) Exemplary luminescence images of 24-well plates used for screening at 6 dpi. Each well harbors a plant inoculated with a different Sphingomonas sp. Fr1 mutant. The luminescence signals are represented in colors as indicated by the scale bar (in arbitrary units). Sphingomonas mutants unable to restrict P. syringae DC3000 lx proliferation showed higher luminescence signals and are circled in green.

