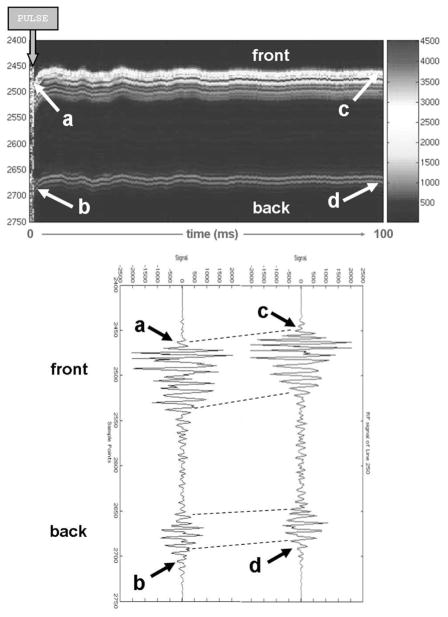
Fig. 4.
Typical displacement profile for a single pulse given in a clot. (Upper image) Sequence of RF lines in the focal zone, indicating the displacement immediately after the pulse is given and the gradual relaxation over a period of 100 ms. (Lower image) Individual RF lines at the beginning (where the displacement is maximal) and end of this period. Relatively bright signals (upper image) and large amplitudes (lower image) correspond to the front and back of the tubing.

