
Figure 2.
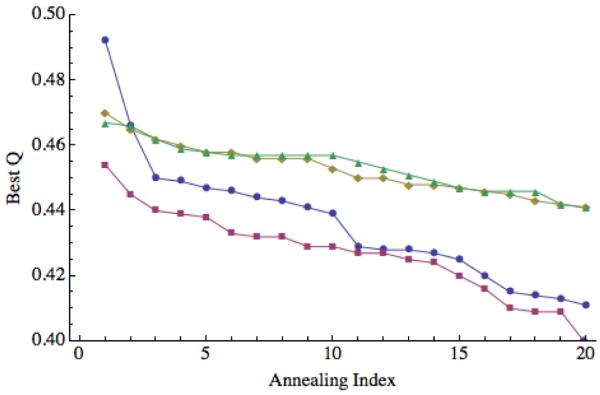
Prediction quality for 1UZC, including and excluding disordered region. For each of the 20 annealing simulations, the maximum Q values obtained are plotted in descending order. Blue circles correspond to “homologs excluded” predictions and red squares to “homologs allowed” predictions when the disordered region is included in the calculation of Q. Green triangles correspond to “homologs excluded” predictions and orange diamonds to “homologs allowed” predictions when the disordered region is excluded from the calculation of Q.