
Figure 9.
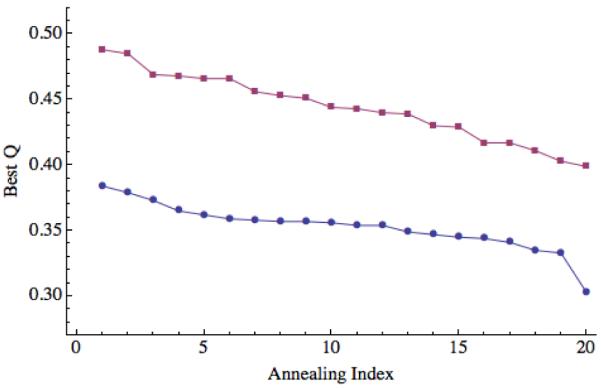
Prediction quality for 1N2X, including and excluding the first 22 residues, a disordered region. For each of the 20 annealing simulations, the maximum Q values obtained are plotted in descending order. Blue circles correspond to the maximum Q values when the disordered region is included and the red squares correspond to the maximum Q value when the disordered region is excluded from the calculation of Q.