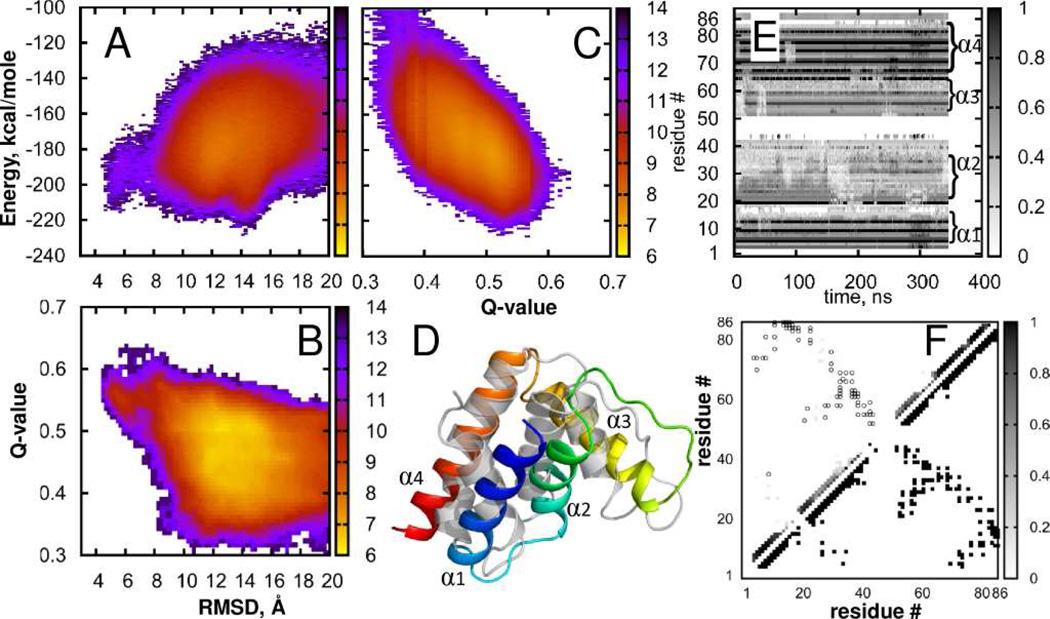
FIGURE 2.
Acyl-coenzyme A binding protein (ACBP). States density maps (A) Energy vs. RMSD; (B) Q-value vs RMSD; (C) Energy vs. Q-value; (D) Best fit of simulated (rainbow) to native structure (gray) displayed using the cartoon representation in PyMol; (E) Per-residue native contact frequency in a sample trajectory, (F) Density of native contacts. Lower triangle shows native contacts, gray squares in the upper triangle indicate probability to observe native contacts in our simulations, open circles show native contacts with probability to observe below Pthreshold = 0.03. More details are provided in the Supporting Information.

