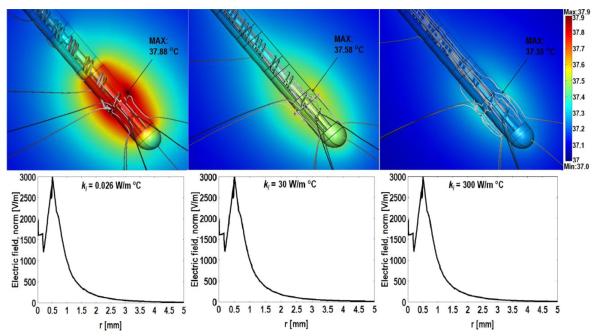
Figure 6.
Temperature distribution in brain tissue around the DBS 3389 lead (tissue electrical and thermal conductivities were 0.35 S/m and 0.527 W/m C respectively) with standard and ‘enhanced’ lead insulation. Thermal conductivity (ki) was to 0.026 W/m °C (left), 30 W/m °C. (Center), 300 W/m °C (right). The false color map indicates the temperature profiles around the stimulating DBS electrodes and gray lines indicate the heat flux distribution. Electric field distribution along the axial direction between the two energized electrodes (lower plots).

