
Figure 2.
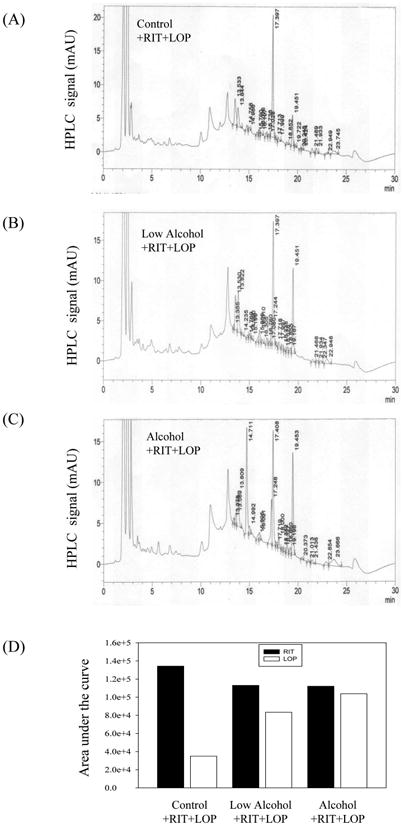
Effect of alcohol on HIV protease inhibitor levels in mouse plasma. HPLC spectra of ritonavir (RIT) and lopinavir (LOP) from plasma of mice gavaged with control diet plus RIT and LOP (A), half doses of alcohol diet plus RIT and LOP (B), and alcohol diet plus RIT and LOP (C); (D) Quantitation of the HIV drugs in the mouse plasma. HPLC analysis was run twice and the representative spectra were shown.