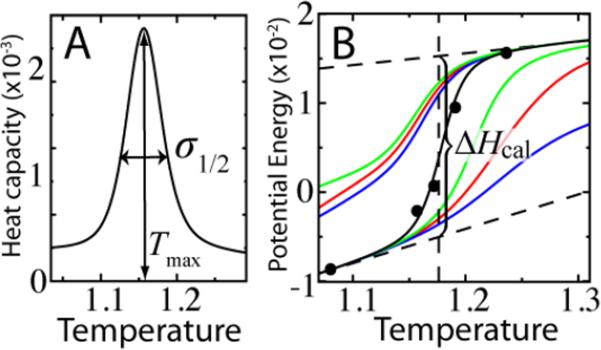
Figure 3.
Measures of cooperativity. (A) κ1 = σ1/2/Tmax. σ1/2 is the width of the heat capacity at half the maximum. (B) κ2 is a measure of the enthalpy change associated the transition relative to the total enthalpy change ΔHcal. The behavior of the enthalpy in the folded and unfolded states is modeled linearly (horizontal dotted lines). The vertical dotted line marks TF. Weighted histogram analysis gives the continuous lines. Black dots show 〈H〉 during constant temperature molecular dynamics. The blue, red and green lines show the folded and unfolded state enthalpy for different rmsd cutoffs, dc of 5, 6, and 7 Å, respectively.

