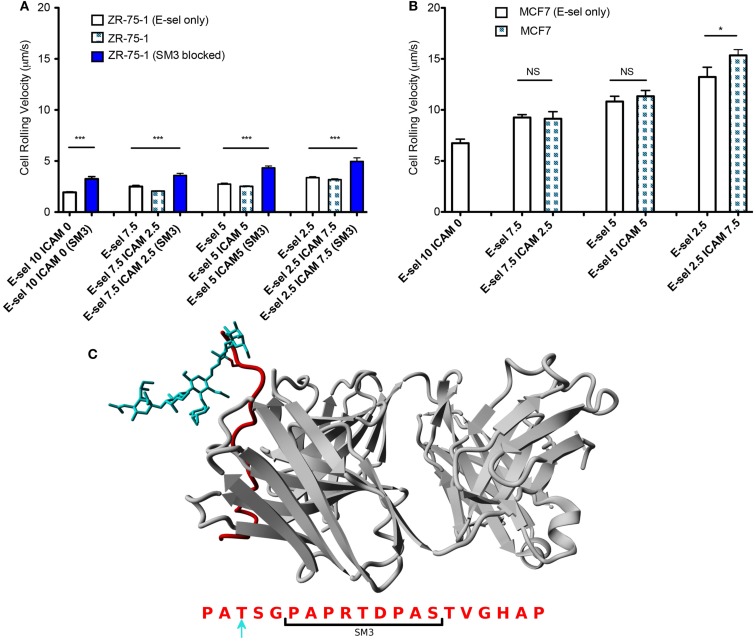
Figure 5.
(A,B) Rolling velocities of ZR-75-1 (untreated and blocked) and MCF7 cells on combined and E-selectin surfaces with varying incubation concentrations under flow, respectively. (C) Equilibrated structure of SM3 (gray) bound to the core epitope of one repeat unit of MUC1 (red) singly O-glycosylated with sLex (blue) on a threonine residue. Below is the amino acid sequence of a MUC1 repeat unit where the bracket indicates the interaction site of SM3 and the blue arrow indicates the chosen O-glycosylated amino acid. Student’s t-test and ANOVA were used for statistical analysis. *p ≤ 0.05; ***p ≤ 0.001; NS, non-significant.

