
Fig. 2.
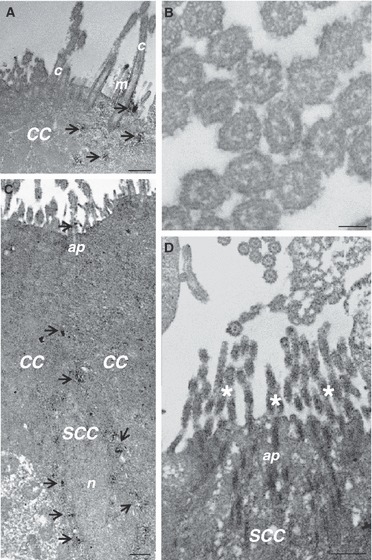
Immunoelectron microscopy for GLUT2 in ciliated (CC) and solitary chemosensory cells (SCC) of the trachea. In CC, GLUT2 immunoreactivity is concentrated on the apical surface (arrow, A); cilia do not show immunostaining (B). In SCC, GLUT2 immunoreactivity is distributed throughout the entire cytoplasm (arrow; C) and in the brush-like set of microvilli on the apical surface (D). ap, apical pole; c, cilia; m, microvilli; n, nucleus; * Brush-like set of microvilli. Scale bar: 500 nm (A,C,D), 100 nm (B).