
Fig. 8.
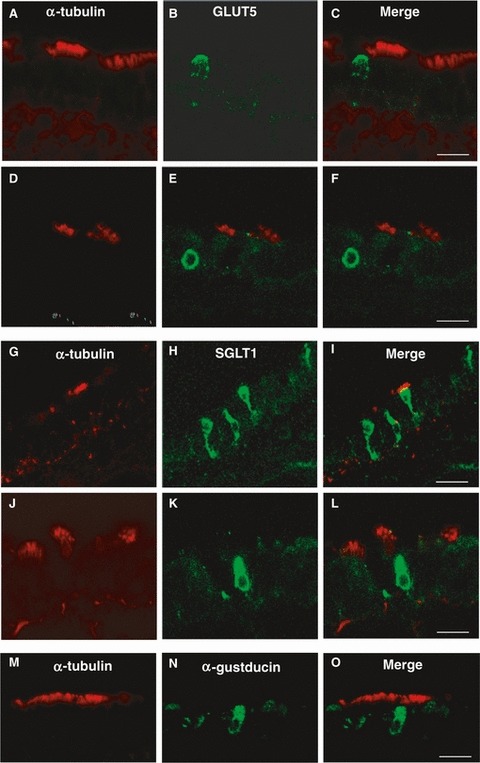
Double-immunofluorescent confocal microscopy showing expression of α-tubulin (red) with GLUT5 (green; A–F), or SGLT1 (green; G–L), or α-gustducin (green; M–O) in tracheal cells. The merge is represented in panels (C, F, I, L, O). GLUT5 immunoreactivity is observed in α-tubulin-negative cells identified as secretory cells (A–C) and in basal cells (D–F). SGLT1 and α-gustducin immunoreactivities are observed in α-tubulin-negative cells identified as solitary chemosensory cells (G–L and M–O, respectively). Scale bar: 30 μm (I), 20 μm (C,F,L,O).