
Fig. 9.
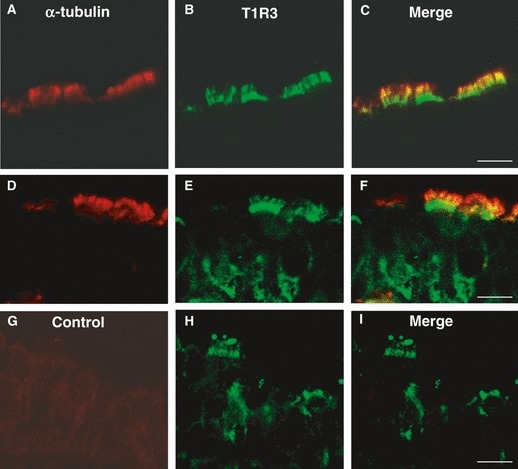
Double-immunofluorescent confocal microscopy showing expression of α-tubulin (red) with T1R3 (green) in tracheal cells. The merge is represented in panels (C,F,I). α-Tubulin and T1R3 are colocalized in some spots on the cilia (A–F). Labeling for T1R3 is also observed in the apical cytoplasm beneath the cilia, and on the basolateral membrane of ciliated cells (D–F). Double-labeling is not observed when anti-α-tubulin antibody was omitted (G–I). Scale bar: 20 μm (C), 10 μm (F,I).