
Fig. 2.
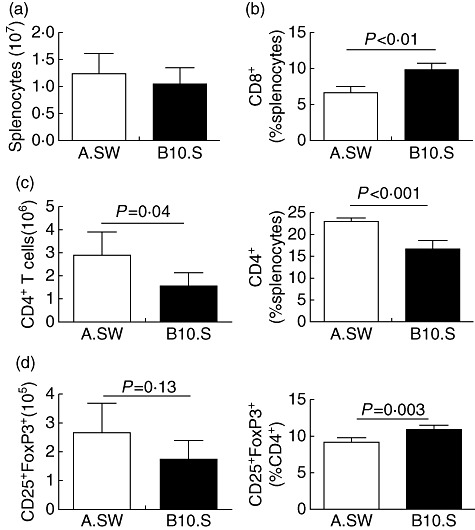
Naive A.SW mice increased relative frequency of CD4+ T cells compared to B10.S spleens. (a) Number of total splenocytes in naive A.SW and B10.S mice. (b) The percentage of CD8+ T cells in the spleen of naive A.SW and B10.S mice. (c) The absolute count and relative proportion of CD4+ T cells in the spleen of naive A.SW and B10.S mice. (d) The total counts and percentages of CD4+-gated CD25+forkhead box protein 3 (FoxP3+) T cells in the spleen of naive A.SW and B10.S mice. Data are presented as the mean ± standard deviation. Statistics are by two-tailed Student's t-test. Data depict one representative experiment of three conducted with five mice per group.