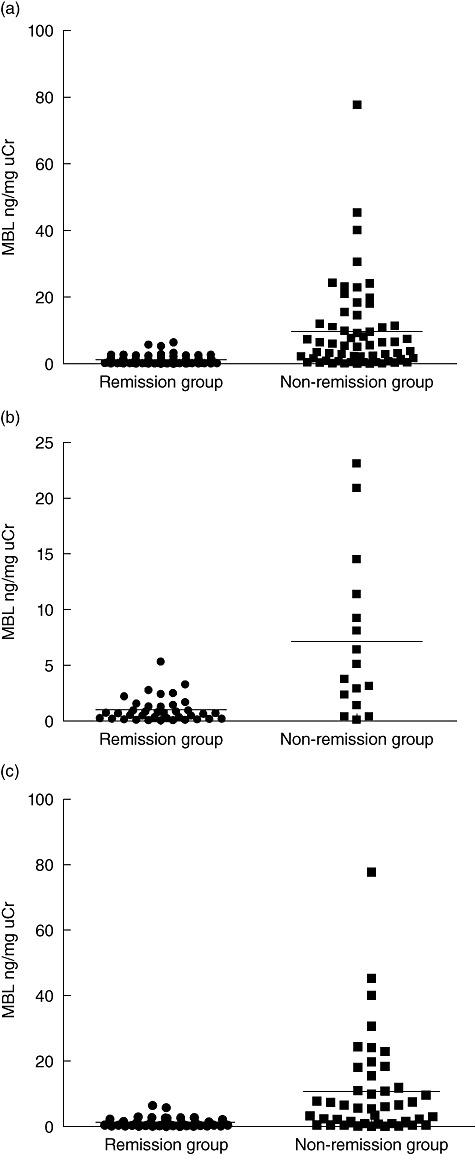
Fig. 5.

Comparison of urinary mannose-binding lectin (MBL) between remission and non-remission groups. (a) Comparison in all the patients who completed the whole period of follow-up. (b) Comparison in patients with non-immunosuppressive therapy. (c) Comparison in patients with immunosuppressive therapy. The horizontal solid lines indicate the median values for each group.
