
Fig. 4.
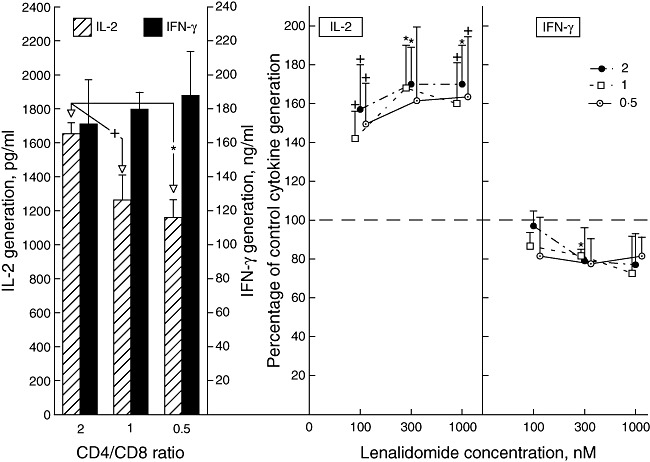
Influence of CD4 : CD8 T cell ratio on healthy male human T cell generation of interleukin (IL)-2 and interferon (IFN)-γ and the effects of lenalidomide on T cell cytokine generation. Left-hand frame: each column and bar depicts the mean ± standard deviation (s.d.) of the concentrations of IL-2 and interferon (IFN)-γ attained by activated T cells from three male subjects. The statistical significance of differences in IL-2 concentrations between T cells at a CD4 : CD8 ratio of 0·5 and 1 compared to that at a ratio of 2 is shown by the same symbols as in Fig. 1. Right-hand frames: each point and bar depicts the mean ± s.d. of the cytokine concentration achieved by lenalidomide-treated activated T cells from the three subjects as a percentage of that by the same T cells without lenalidomide treatment (100%). Statistical significance of differences between cytokine generation by treated and control T cells is shown as in Fig. 1.