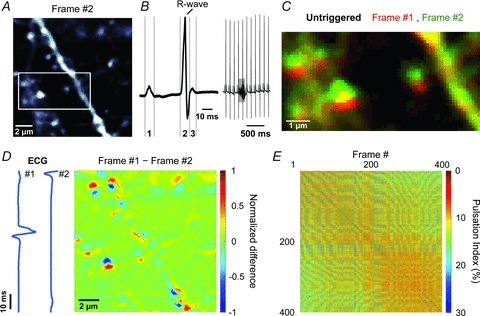
Figure 1. Complex in-frame motion artifacts induced during in vivo two-photon imaging of the brain.

A, representative fluorescence image (#2) from a series of 400 images of a 14 μm × 14 μm region of cortex from a Thy1-EGFPM mouse. White box highlights region shown in panels C and Fig. 2I. B, left, representative ECG waveform showing the P-wave (1), representing depolarization of the atrial myocardium; the QRS-complex (2), representing depolarization of the ventricular myocardium; and the T-wave (3), representing repolarization of the ventricular myocardium. B, right, continuous ECG recording showing 11 heartbeats and 1 breath (highlighted by the grey box). C, overlay of two consecutive pseudocoloured images (red and green) (region highlighted in A). D, pseudocoloured difference image obtained by subtracting two consecutive images. Values were normalized to the largest absolute difference. Blue traces represent ECG signal recorded during each frame. E, plot of pulsation indices (PIs) of image pairs among 400 consecutive frames. Warmer colours indicate smaller pulsations (higher correlation).
