
Figure 2. ECG-triggered scanning allows real-time motion correction during in vivo two-photon imaging.
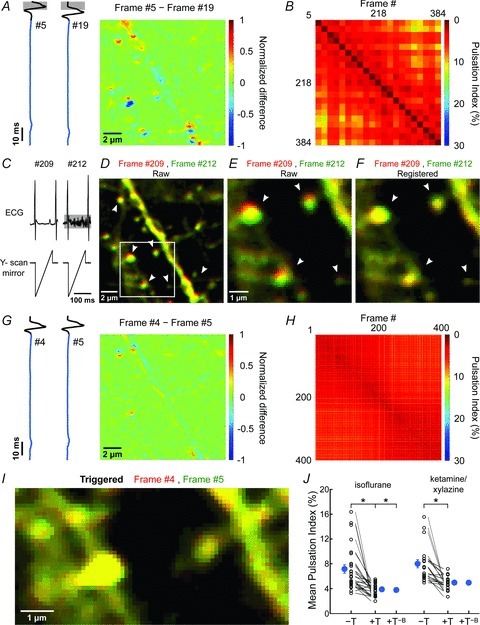
A, pseudocoloured difference image obtained by subtracting two frames serendipitously collected during the same phase of the cardiac R-wave. Grey boxes highlight the search window for the cardiac R-wave. B, plot of PIs of image pairs for which acquisition began within 15 ms after the cardiac R-wave. This condition was met by 21 of 400 frames. C, ECG trace (top traces) and simultaneously acquired Y-scan mirror position signal (bottom traces) for two images shown in D, for which scanning serendipitously occurred in between heartbeats. Note that during acquisition of frame #212 the surface electrodes also recorded the electromyogram (EMG) signal caused by breathing (highlighted by grey horizontal box). D, overlay of two images collected during the scans shown in C. Frame #209 is shown in red and #212 in green. Arrowheads highlight regions where vertical displacement of the dendrite is prominent. White box highlights region shown in panels E and F. E and F, images shown in highlighted region in D before (E) and after (F) performing whole-frame cross correlation registration (see Methods for details). G, pseudocoloured difference image obtained by subtracting two consecutive images collected with ECG-triggered acquisition. Traces at left show the simultaneously collected ECG signals. H, plot of PIs of image pairs during this recording. I, overlay of two consecutive pseudocoloured images (red and green) (region highlighted in Fig. 1A) collected with ECG-triggering. J, plot of the average PI measured with different anaesthetic drugs. PIs calculated from triggered (+T) and untriggered (–T) time series collected sequentially in the same field are connected by lines. ‘+T−B’ represent PIs calculated from triggered time series with frames acquired during breathing removed. Note that this does not lower PI further. Blue symbols, mean ± SEM; *P < 0.001 (paired Student's t test).