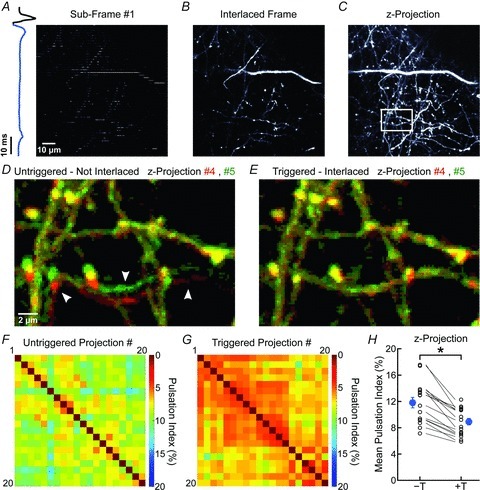
Figure 4. ECG-triggered interlaced scanning reduces motion artifacts during in vivo 3-D imaging.

A, representative fluorescence image from a 100 μm × 100 μm region of the cortex in a Thy1-EGFPM mouse showing one sub-frame (50 lines in the 500 × 500 pixels area) collected between two heartbeats. Blue trace at left represents the simultaneously recorded ECG. B, fluorescence image of a single optical section reconstructed from 10 sub-frames. C, maximum intensity projection fluorescence image created through reconstruction of 14 interlaced frames covering 19.5 μm. White box highlights region shown at higher magnification in D and E. D and E, overlay of two consecutive pseudocoloured images (red and green) (region highlighted in C) collected without (D) or with (E) ECG-triggering. In D, arrowheads highlight movement artifacts. F and G, plot of PIs for pairs of images for 20 consecutive maximum intensity z-projections collected during untriggered, non-interlaced (F) or triggered, interlaced (G) z-stack time series. Warmer colours indicate smaller pulsations (higher correlation). H, plot of average PI measured for z-projections collected through untriggered (–T) and triggered (+T) acquisition. PIs calculated from triggered and untriggered time series collected sequentially in the same field are connected by lines. Blue symbols, mean ± SEM; *P= 2 × 10⁻⁶ (paired Student's t test).
