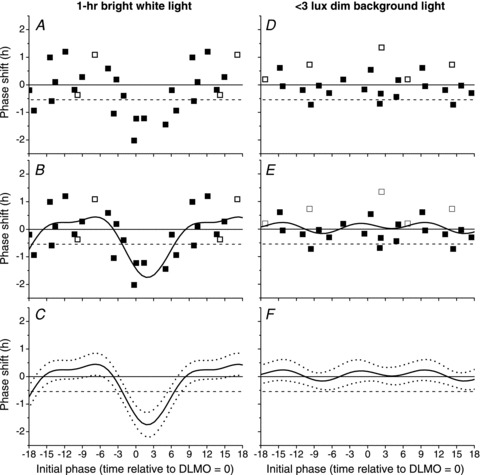
Figure 3. Phase response curve to 1 h of bright white light or <3 lux dim background light.

Exposure to a 1 h pulse of bright white light (left panels) or <3 lux dim background light (right panels). Raw phase shifts were computed using either plasma (▪) or salivary (□) melatonin (panels A, B, D and E) and fitted with a two-harmonic function (continuous line, panels B, C, E and F). Significant phase delays and advances were determined by comparing the overlap of 95% confidence intervals (dashed lines, panels C and F) to the zero phase shift line (continuous horizontal line, all panels) and the −0.54 h no net phase shift line based on drift due to intrinsic circadian period (dashed horizontal line, all panels). Initial phase was defined as the DLMO on CR1 relative to the onset of light exposure; negative values on the abscissa indicate onset of light exposure occurring prior to DLMO on CR1 and positive values indicate onset of light exposure occurring after DLMO on CR1.
