
Figure 5. Comparison of 1 h and 6.7 h bright white light and dim background light PRCs.
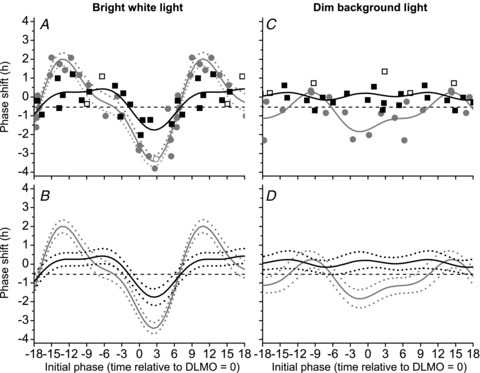
The raw data (symbols), two-harmonic fits (continuous lines) and 95% confidence intervals (dashed lines) for both the 1 h (black) and 6.7 h PRCs (grey) to bright white light (left panels) and dim background light (right panels) were plotted by circadian phase defined as the DLMO relative to the midpoint of light exposure, with negative values indicating midpoint of light exposure occurring before DLMO and positive values indicating midpoint of light exposure occurring after DLMO.