
Figure 1. Raster plot of the 9-day study protocol.
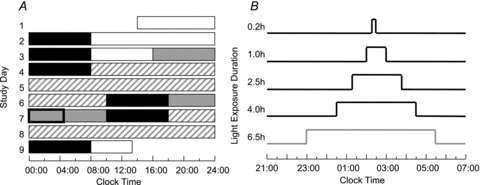
A, the representative raster is for a participant with a habitual sleep schedule of 12 am–8 am. Sleep episodes are denoted by the black bars. Open bars represent 90 lux levels, grey bars show <3 lux levels and striped bars represent CR conditions in 1 lux. The box on day 7 shows the timing of the 4.5 h episode of constant posture. B, light exposure was scheduled within the 4.5 h constant-posture procedure on day 7. The 4 h LE was scheduled to start 0.5 h after the start of constant posture. The 1 h and 2.5 h LEs were aligned by midpoint to the 4 h LE. The midpoint of the 0.2 h LE was shifted 12 min earlier compared with the 1 h and 2.5 h LE. The timing of the 6.5 h LE was conducted under a separate set of experiments (Gronfier et al. 2004) and is included for comparison.