
Figure 3. Duration–response curves of melatonin phase shifts and suppression.
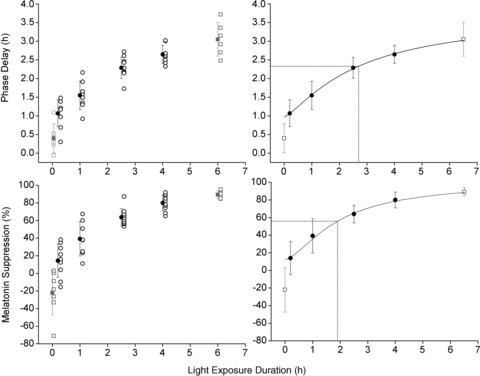
Individual and mean phase shifts and melatonin suppression for each of the 4 LE duration groups studied under the current set of experiments (black symbols) and the 6.5 h LE and dim background controls studied previously (grey symbols) (Gronfier et al. 2004). The panels on the left show the phase delay (top) and melatonin suppression (bottom) for the individual participants (open symbols) and mean ± SD (filled symbols) for the groups. The panels on the right again show the mean phase shift (top) and suppression (bottom). Data on the right are fitted using a 4-parameter logistic model and the predicted half-maximum values are shown. The dim background controls were excluded from the fit.