
Figure 4. Subjective sleepiness and melatonin concentrations during LE day.
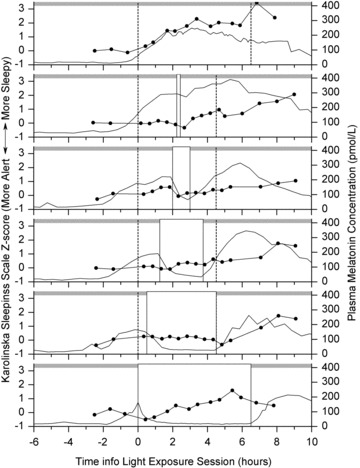
Mean KSS z-scores (symbols with line) and plasma melatonin levels (continuous line) are shown for the control, 0.2 h, 1.0 h, 2.5 h, 4.0 h and 6.5 h duration groups (top to bottom). The grey area represents the 1 lux level. The white boxes (continuous lines) represent the ∼10,000 lux LE. The dotted lines show the timing of the constant posture (0-4.5 in the current study; 0-6.5 in the groups studied previously (Gronfier et al. 2004).