
Figure 1. Effects of glutamate on membrane potential and input resistance.
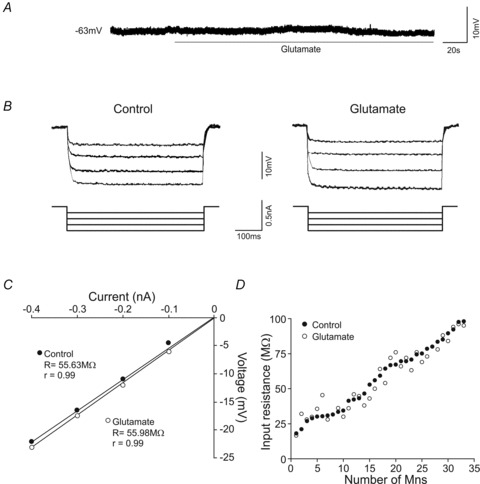
A, membrane potential response to glutamate exposure. B, responses of the membrane potential to hyperpolarizing current pulses of the same intensities in control and glutamate conditions. C, plot illustrating the current/voltage relationships to determine the input resistance (R) for the motoneuron illustrated in B. D, plot illustrating the value of input resistance for each motoneuron in control and glutamate conditions. All analysed motoneurons are represented and arranged as a function of their input resistance.