
Figure 2. Effects of glutamate on rheobase and depolarization voltage.
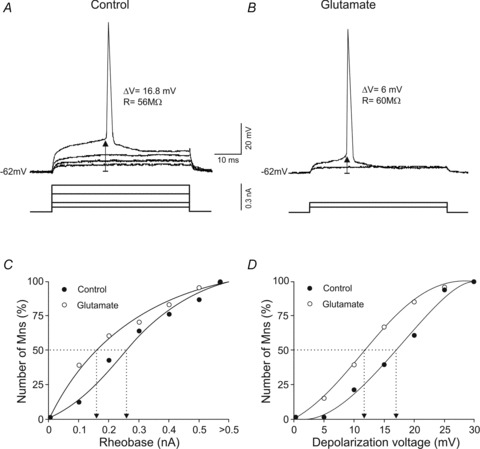
A and B, recordings showing the minimum current (rheobase) and voltage depolarization required to evoke an action potential in the same motoneuron in control and glutamate conditions. ΔV and R indicate depolarization voltage and input resistance, respectively. C and D, cumulative normalized plots of rheobase and depolarization voltage in control and glutamate conditions. The dotted lines show the rheobase and depolarization values at which 50% of the motoneurons evoked an action potential.