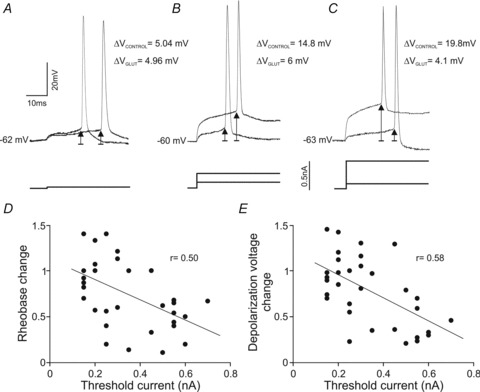
Figure 3. Effects of glutamate on rheobase and depolarization voltage as a function of the recruitment threshold.

A–C, three representative motoneurons with low- (A), mid- (B) and high- (C) threshold recorded in control and glutamate conditions. ΔV indicates depolarization voltage. D and E, plots illustrating the change in both rheobase and depolarization voltage as a function of the recruitment threshold current.
