
Figure 8. Effect of glutamate on spike frequency adaptation.
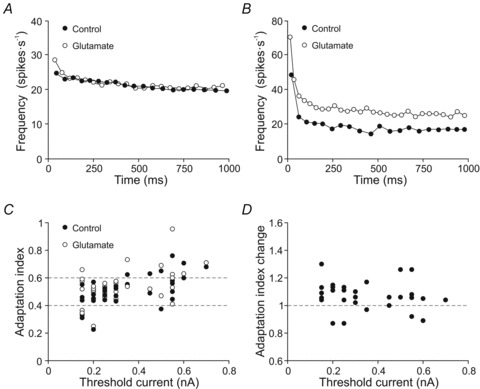
A and B, plots representing the instantaneous frequency of a low-recruitment threshold current motoneuron (A) and a high-recruitment threshold current motoneuron (B) in control and glutamate conditions. C, plot illustrating the values of initial adaptation index as a function of the recruitment threshold current in control and glutamate conditions. Note most of the motoneurons had adaptation index between 0.4 and 0.6 (grey lines). D, plot illustrating the change in the adaptation index as a function of the recruitment threshold current.