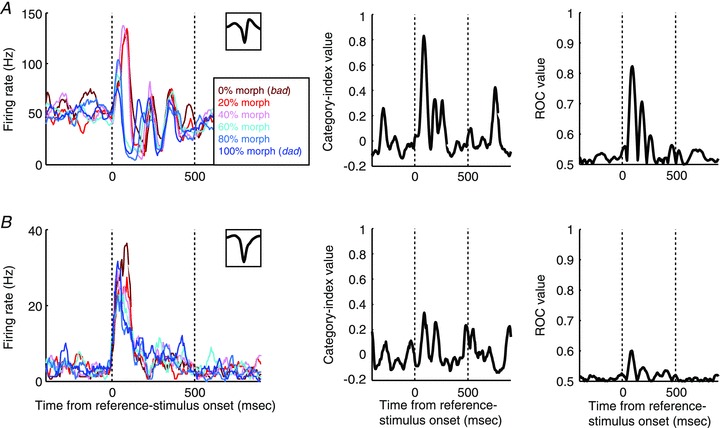
Figure 2. Categorical responses of an NS neuron (A) and a BS neuron (B) during presentations of the reference stimulus.

The plots in the left column show the mean firing rates of the two neurons as a function of time and the reference stimulus presented. The inset in the upper graph of each plot shows the neuron's waveform. The middle column shows each neuron's category-index values as a function of time. The right column shows ROC values as a function of time. For all of the panels, the two vertical dotted lines indicate stimulus onset and offset, respectively.
