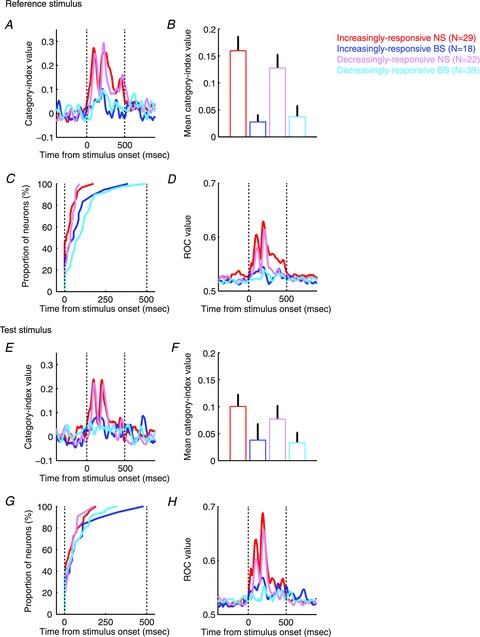
Figure 3. Population results of category index and ROC analysis.

The temporal profile (A and E), mean (B and F), and latency of the category index (C and G) during reference-stimulus presentation and test-stimulus presentation. The panels in D and H plot the temporal profile of ROC values. Error bars represent bootstrapped 95% confidence intervals of the mean.
