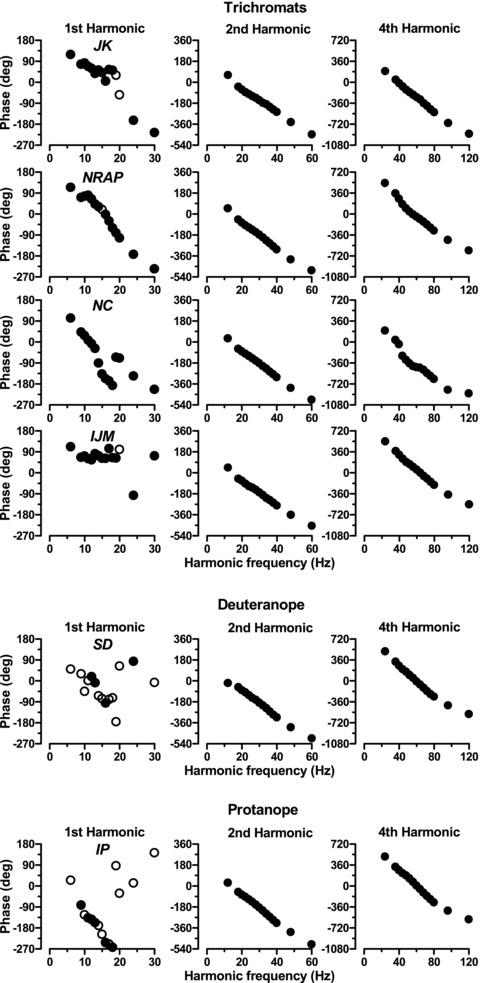
Figure 7. ERG phase as a function of harmonic frequency for fundamental, 2nd and 4th harmonics.

The top 4 rows are the 4 trichromats’ data and the bottom 2 rows are the dichromats’ data. For the 1st harmonic data, filled circles depict phase where signal:noise ratio exceeded 4, and open circles depict the remainder.
