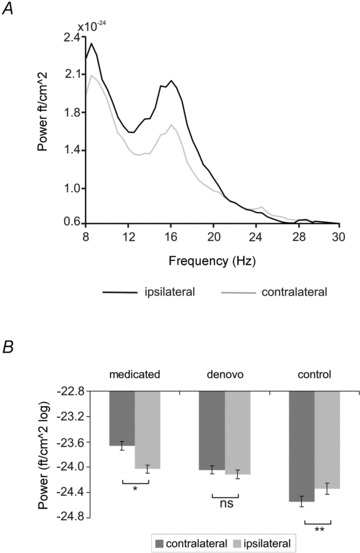
Figure 2. Analysis of MEG spectral power during isometric contraction.

A, power averaged across sensors covering S1/M1 contra- and ipsilateral to isometric contraction in one control subject. Note that power of the hemisphere contralateral to isometric contraction is suppressed at frequencies below 30 Hz as compared to the ipsilateral side. B, mean power of ipsi- and contralateral S1/M1 in medicated and de novo patients and control subjects at beta frequency. Power was estimated by logarithmic transformation. Error bars indicate SEM.
