
Figure 6. Analysis of EMG spectral power during isometric contraction.
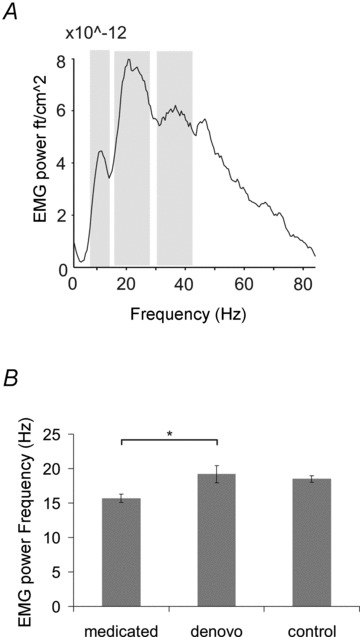
A, the spectrum of one characteristic control subject. Discernible peaks at alpha (8–12 Hz), beta (13–30 Hz) and low gamma (30–60 Hz) frequencies were evident. B, while power amplitude did not differ between groups at any of these frequencies, a shift towards lower frequencies was found in medicated patients in the beta range. Shown are mean frequency values. Error bars indicate SEM.