
Figure 1.
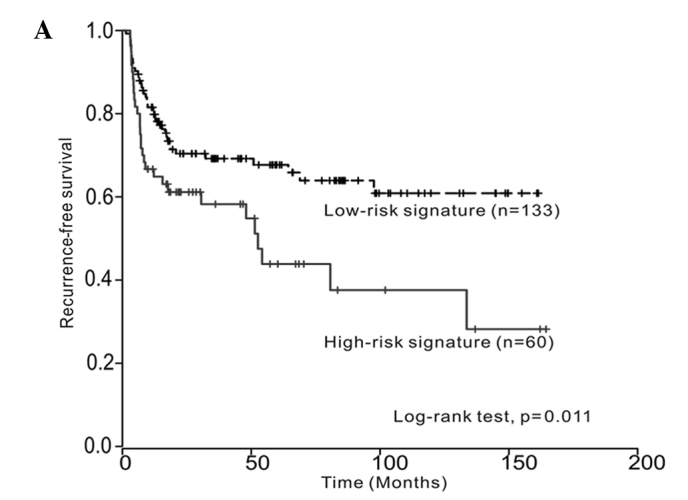
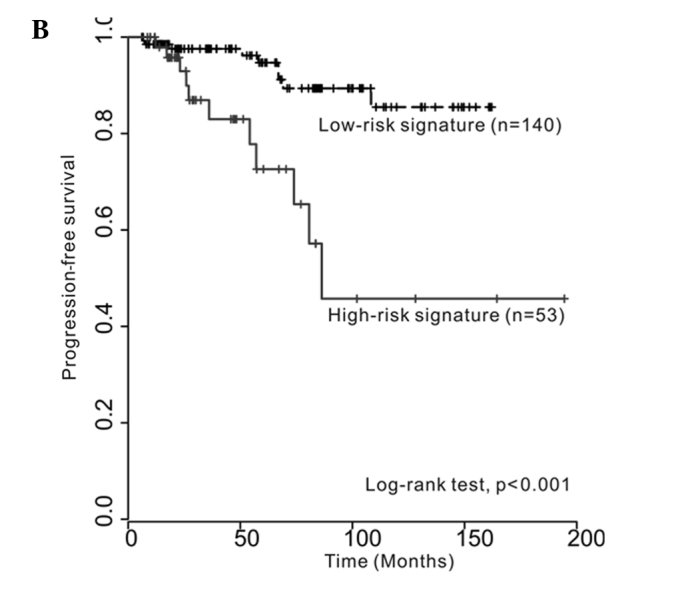
Kaplan-Meier curves showing (A) time to recurrence and (B) time to progression between low- and high-risk signatures (log-rank test, p=0.011 and p<0.001, respectively).
Official websites use .gov
A
.gov website belongs to an official
government organization in the United States.
Secure .gov websites use HTTPS
A lock (
) or https:// means you've safely
connected to the .gov website. Share sensitive
information only on official, secure websites.
Kaplan-Meier curves showing (A) time to recurrence and (B) time to progression between low- and high-risk signatures (log-rank test, p=0.011 and p<0.001, respectively).