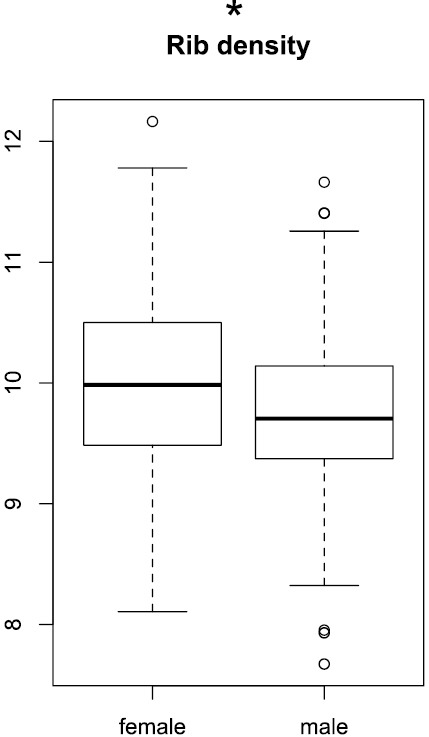
Figure 7.

Boxplots of rip density. Significance levels of Wilcoxon test: ‘***’ p < 0.001, ‘**’ p < 0.01, ‘*’ p < 0.05, ‘.’ p < 0.1, ‘ ’ p < 1.

Boxplots of rip density. Significance levels of Wilcoxon test: ‘***’ p < 0.001, ‘**’ p < 0.01, ‘*’ p < 0.05, ‘.’ p < 0.1, ‘ ’ p < 1.