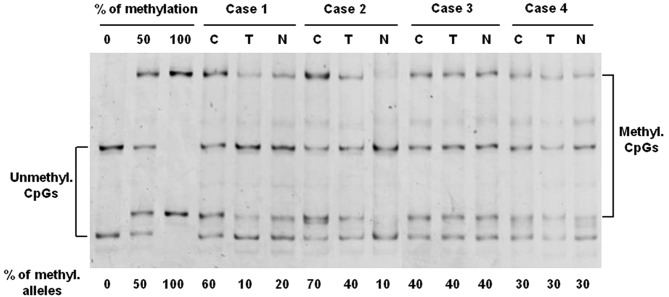
Figure 1.
Analysis of the hTERT promoter methylation by MS-SSCA. Four representative cases, with tumor, transitional and normal mucosa, are shown. Square brackets indicate the migration of the unmethylated DNA (Unmethyl. CpGs) and the hypermethylated DNA (Methyl. CpGs). The percentage of methylated alleles is reflected by the ratio of intensity between the methylated and unmethylated bands. The percentage of methylation is shown under each sample. C, cancer tissue; T, transitional tissue; N, normal tissue. 0, 50 and 100% is the scale of methylation.

