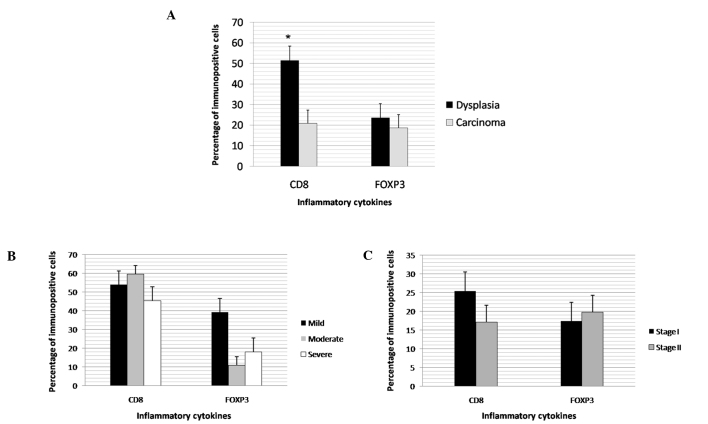
Figure 1.
Expression of CD8 and FOXP3 according to (A) the type of lesion, (B) histological grades of dysplasia, and (C) stages of oral squamous cell carcinoma. The percentage of immunopositive cells is shown in the hatched columns. Bars are the mean ± SD. The expression of CD8 in dysplasia was found to be higher than in carcinoma (*p<0.00001).

