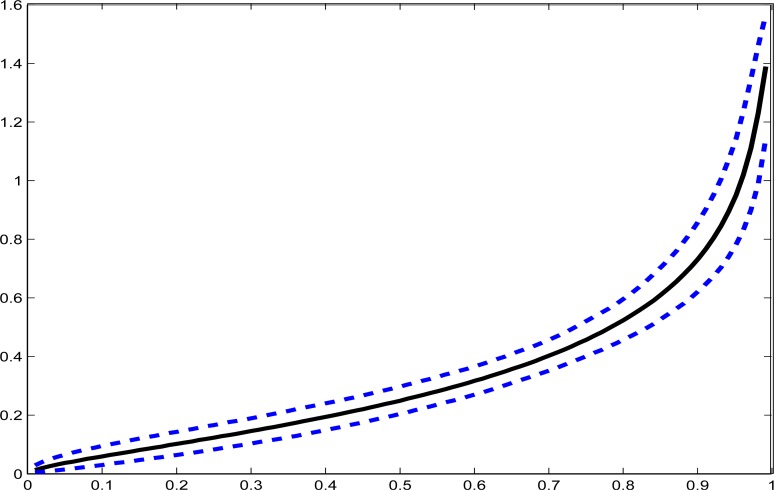
Figure 3:
Quantile functions for usual fish intake per 1000 kilo-calories. Horizontal axis is the relative percentile, e.g., the value at 50 is the median. The vertical axis is the estimated percentile (solid line) in the unit of oz./(1000 kcal). Dashed lines are the pointwise 95% bootstrap confidence intervals.

