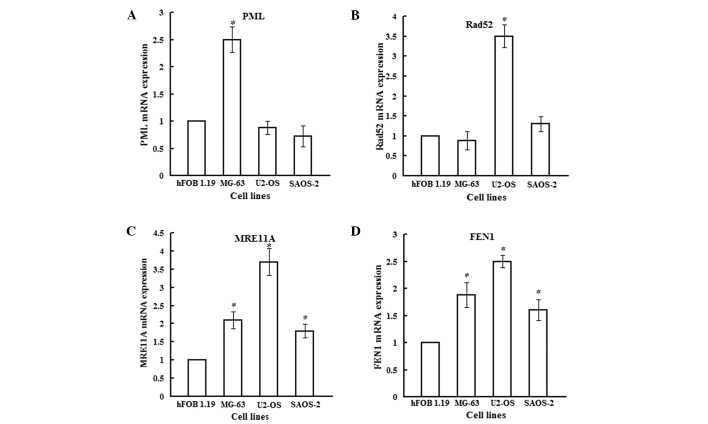
Figure 2.
The mRNA expression of PML, Rad52, MRE11 and FEN-1 by qRT-PCR in the different cell lines. The CT value is the fractional cycle number at which the fluorescence passes the fixed threshold. The value of 2−ΔΔCT is the relative expression of mRNA in each cell line compared with hFOB 1.19. *P<0.05.

