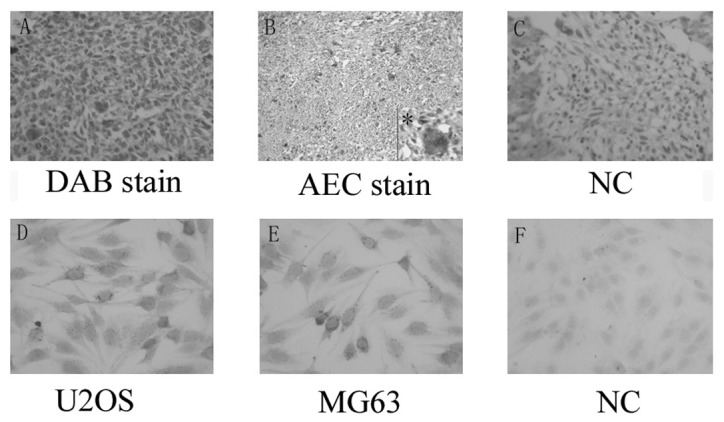
Figure 1.

α-smooth muscle actin (α-sma) expression in osteosarcoma. (A–C) Representative samples of the staining for α-sma developed by DAB and AEC in osteosarcoma, with the corresponding negative control (magnification, ×400). (D–F) Staining for α-sma in U2OS and MG63 cells, and the negative control (magnification, ×400). *Magnification, ×200; with ×400 on the low right inset.
