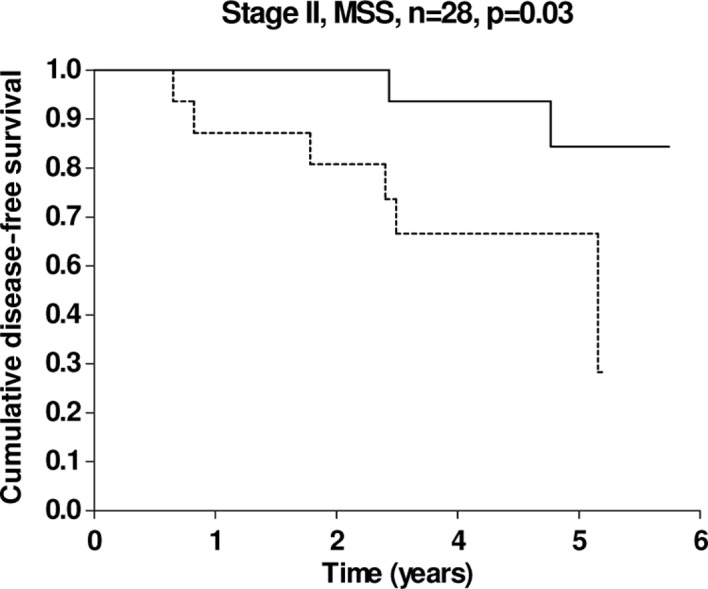
Figure 3.

Kaplan-Meier DFS curves according to miRNA-126 expression in patients with stage II and MSS tumours, n=28 (14 patients in each group). The solid line pertains to patients with a low miRNA-126 expression and the dashed line to patients with a high miRNA-126 expression, p=0.03.
