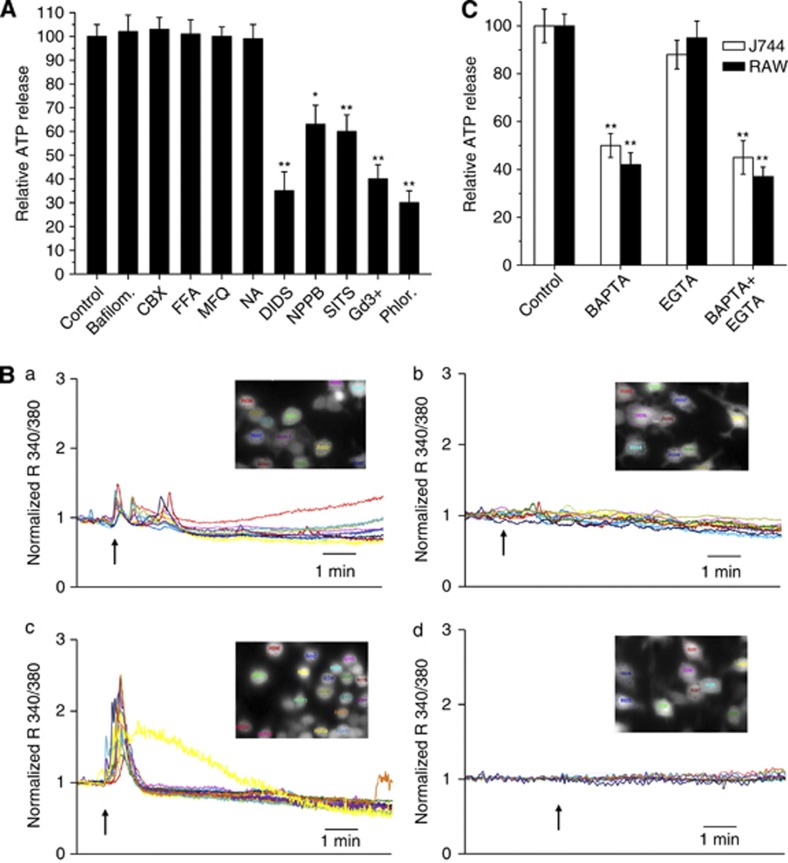
Figure 3.
Characterization of the ATP release induced by Mt-II (1.5 μM) on macrophages. (A) Effect of bafilomycin and inhibitors of ATP channels. ATP present in the extracellular medium was determined 5 min after the intoxication. Values are mean±S.D. of four independent experiments on J774.A1. RAW264.7 cells give identical results (data not shown). Statistically significant differences were determined via an one-tailed Student's t-test (*P<0.01; **P<0.001). Inhibitors were used at the same concentrations indicated in Table 1. Bafilomycin A1 was used at 0.2 μM. (B) Calcium imaging of RAW264.7 cells loaded with fura-2 AM and treated with Mt-II (1.5 μM) in mKRB (top-left panel) or in Ca2+-free EGTA (0.2 mM)-containing medium (bottom-left panel). Top- right panel shows an addition of the same volume of mKRB without the toxin to fura-2 loaded cells. Bottom-right panel: fura-2 loaded cells were pretreated, before the intoxication with Mt-II in mKRB, with cyclopiazonic acid (20 μM, CPA) and EGTA (0.6 mM) to deplete intracellular calcium stores. The arrows indicate the time at which the toxin was added. The same results were obtained in at least three independent experiments for each condition. The inserts correspond to pictures of the evaluated cells before the addition of toxin or buffer, to correlate each colored trace to a specific cell. Representative ratios from each picture are shown. Similar results were obtained with J 774 cells (data not shown). (C) Release of ATP induced by Mt-II, 5 min after the intoxication, in cells preloaded with BAPTA-AM (2 μM) or in the presence of EGTA (1.5 mM) in the extracellular medium. Values are mean±S.D. of four independent experiments. Statistically significant differences were determined via an one-tailed Student's t-test (*P<0.01; **P<0.001)

