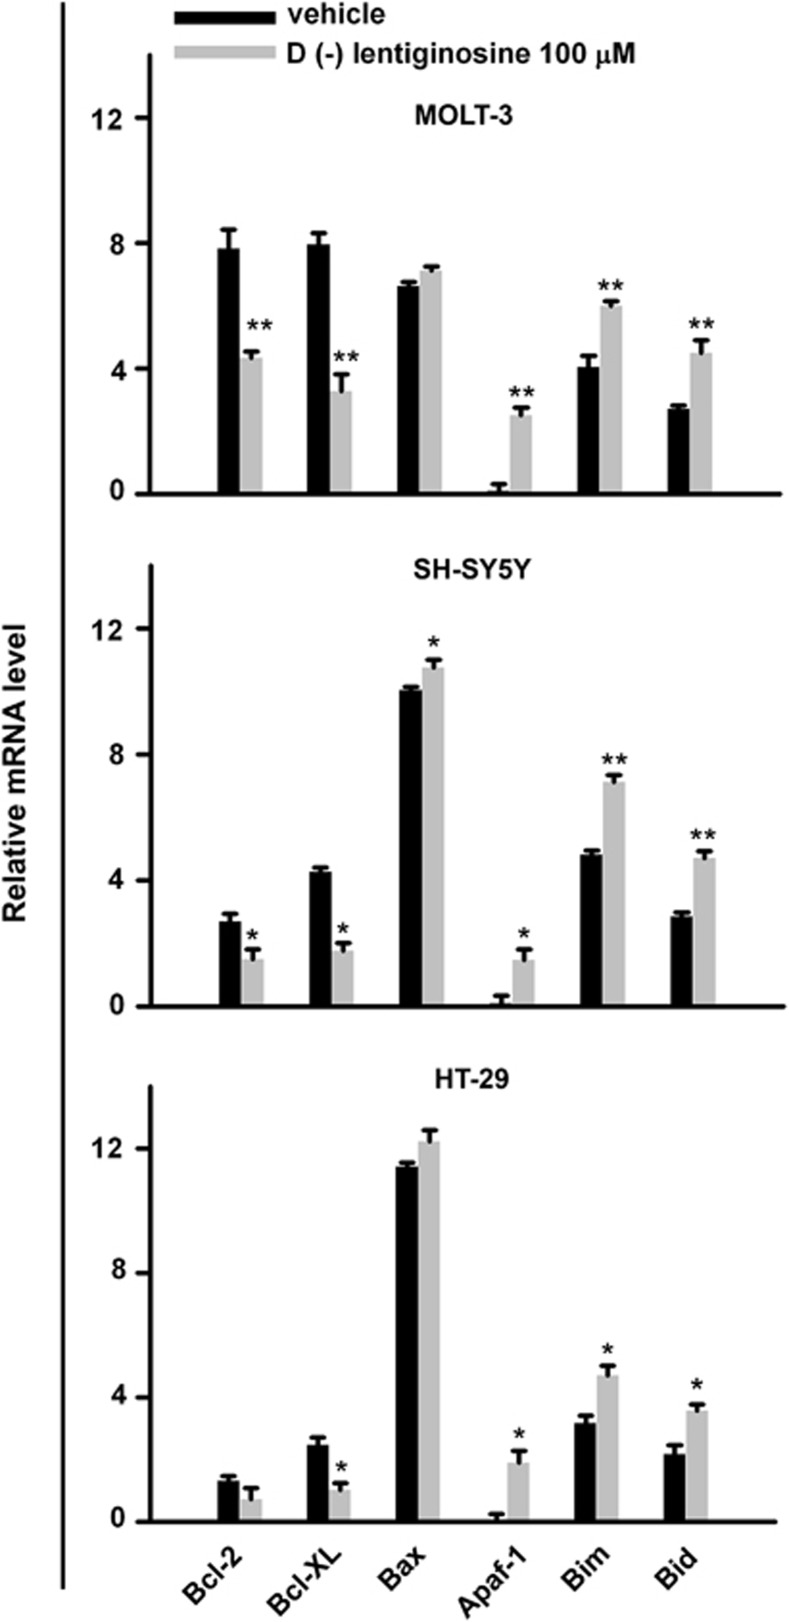
Figure 4.
Real-time analysis of Bcl-2 family gene transcripts. BCL-2, BCL-XL, BAX, APAF-1, BIM and BID expression was assessed after treatment with 𝒟(−)lentiginosine 100 μM for 18 h in MOLT-3, SH-SY5Y and HT-29 cells. The histograms represent mean values±S.D. from triplicate samples and are expressed as fold change in mRNA levels with respect to the less expressed gene, following normalization with an housekeeping gene. Asterisks indicate significant difference between treated and control cells, (*P <0.05 and **P <0.001)

