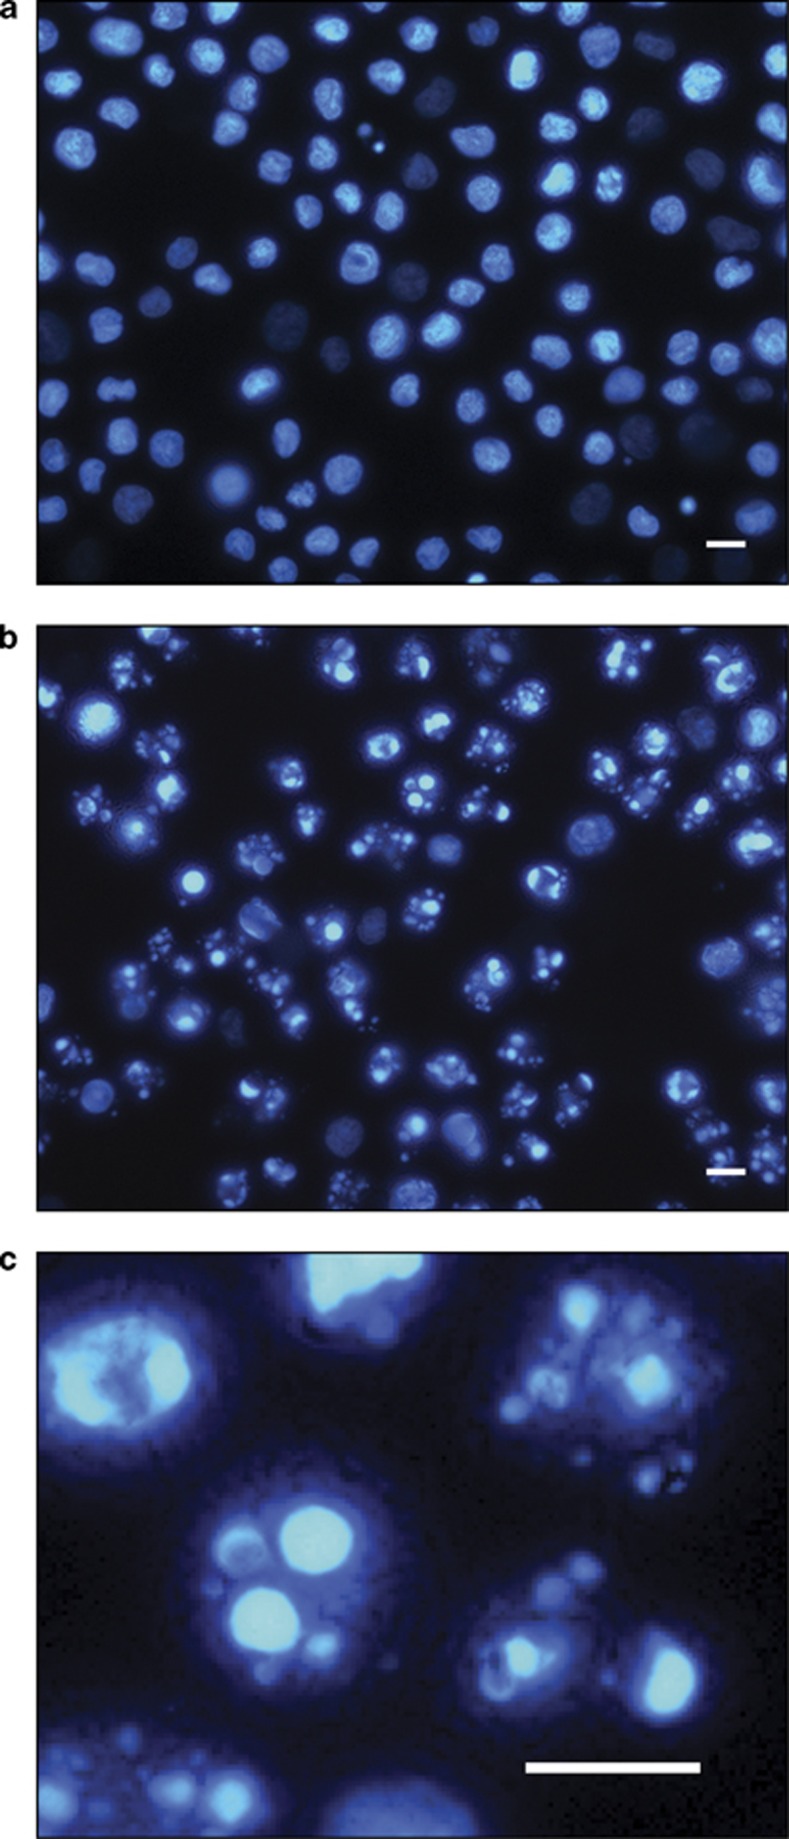
Figure 7.
Fluorescence microscopy analysis of U937 cells treated with 𝒟(−)lentiginosine. Control cells (a) and cells treated with 500 μM 𝒟(−)lentiginosine (b and c) were analysed at 18 h incubation after staining with the fluorescent DNA-binding dye Hoechst. In treated samples (b and c), many cells show typical characteristics of advanced apoptosis with nuclei present as one or, more frequently, more groups of featureless, bright, spherical beads. (c) Detail of b. Original magnification ( × 630). Scale bar=10 μm

