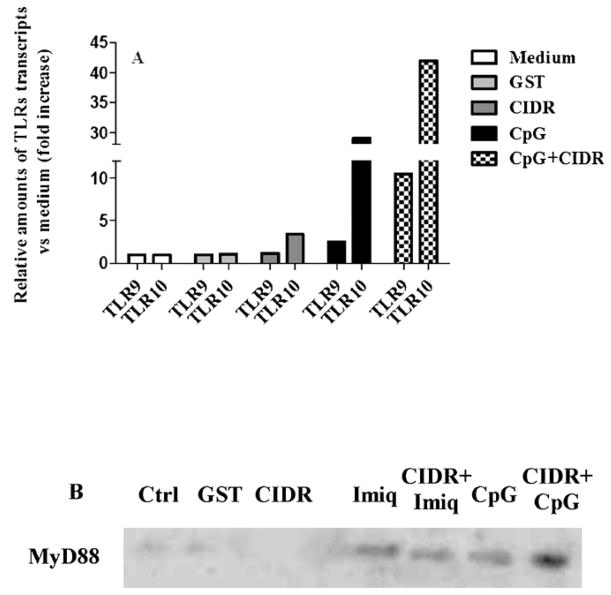
Fig. 3.
CpG 2006 coincubation with PfEMP1–CIDR1α on TLR9 and TLR10 mRNA expression and MyD88 protein level. (A) Relative amounts of TLR9 and TLR10 transcripts versus unstimulated control (value normalized to the unit: 1), after incubation of B cells with GST, PfEMP1–CIDR1α, CpG 2006 and PfEMP1–CIDR1α + CpG 2006 for 15 h. The experiment shown is representative of two yielding similar results. (B) Expression of MyD88 was evaluated by Western blotting after 16 h of culture following stimulation with GST, PfEMP1–CIDR1α, Imiquimod, PfEMP1–CIDR1α + Imiquimod, CpG2006 and PfEMP1–CIDR1α + CpG2006. 12 μg of proteins was loaded on each lane of the gel and actin was used as loading control (not shown).

