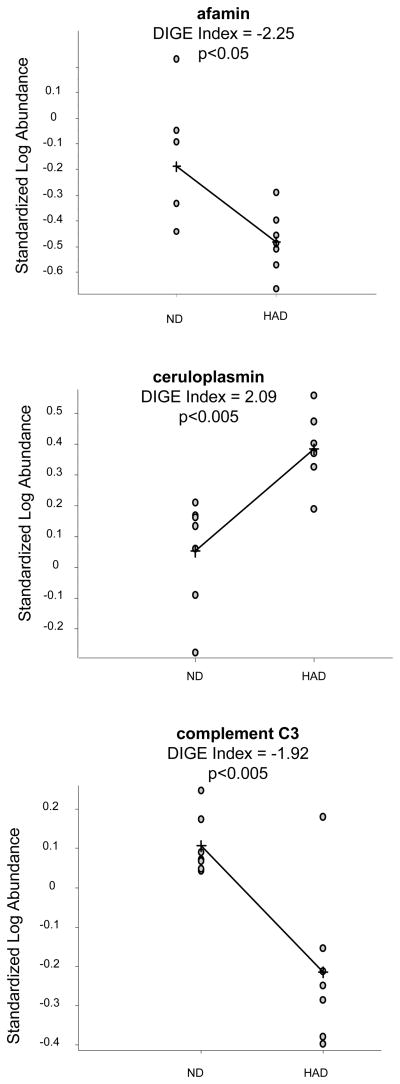
Figure 3.
Results of analysis of spots in which afamin, ceruloplasmin and complement C3 were identified. DIGE Index (average ratio of spot volumes) was calculated in BVA module of DeCyder™ software. Negative values indicate down-regulation in HAD thus positive values indicate up-regulation in HAD. Statistical analysis was performed using T-test in BVA module. p<0.05 was considered statistically significant.

