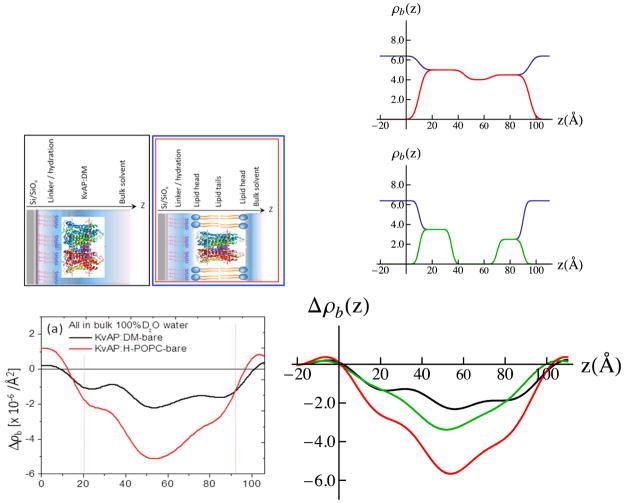
Figure 12.
Experimental difference neutron SLD profiles for the tethered KvAP:DM monolayer and reconstituted KvAP:H-POPC membrane are shown lower left-side, with simple cartoon representations of the systems directly above. In the right-side, upper panel, the refined 3-slab model for the KvAP:VSD is shown in 100%D2O bulk aqueous buffer (black) vs. that as if at the solid/vapor interface in a moist-gas environment (red). In the right-side, middle panel, the refined 3-slab model for the POPC bilayer within the KvAP:H-POPC membrane in shown in 100%D2O bulk aqueous buffer (black) vs. that as if in a moist-gas environment (green). In the right-side, lower panel, the corresponding resolution-limited neutron SLD profiles, calculated via Fourier transform-inverse Fourier transform with (Qz)max-truncation for the 3-slab model for the KvAP:DM monolayer (black) and the KvAP:H-POPC membrane (red) are shown providing reasonably good agreement with their respective experimental counterparts (left-side, lower panel), along with that for the POPC bilayer within the membrane (green). The resolution-limited profile for the membrane (red) was again calculated, assuming that the KvAP protein and POPC bilayer each occupied 50% of the membrane in-plane area in the area-weighted sum of the KvAP (black) and H-POPC (green) profiles. Refinement of the 3-slab models for the KvAP protein and the POPC bilayer was guided in this case only by the comparisons of the experimental profiles with the resolution-limited profiles corresponding to the slab-models for the KvAP:DM monolayer and KvAP:H-POPC membrane systems. The propagation of errors in the neutron reflectivity data into the Fourier representation of the scattering-length density profiles, and their slab-models, is explicitly addressed in the Supporting Information.

