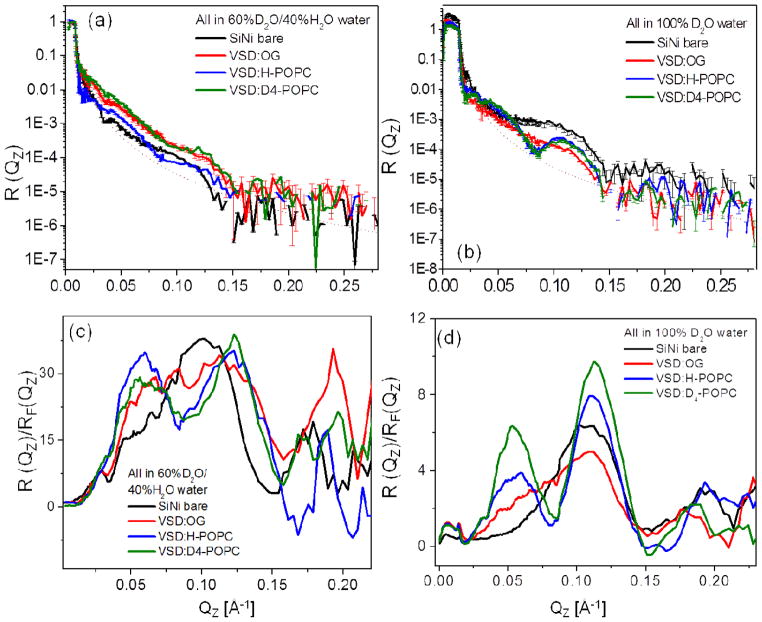
Figure 5.
The interferometric neutron reflectivity results from a typical VSD:OG specimen prepared via the self-assembly (SA) approach. Semi-log plots of the (a, b) background-corrected and (c, d) Fresnel-normalized reflectivity data, for the bare Si-Ni-Si substrate, tethered VSD:OG monolayer, and putative reconstituted VSD:H-POPC and VSD:D4-POPC bilayer membranes, at the solid/liquid interface utilizing an aqueous buffer environment with 100% D2O and 60% D2O/40% H2O. The data are offset vertically (a,b) for visual clarity. The dotted curve in (a) and (b) is the calculated Fresnel reflectivity function, RF. Error bars are included in (a) and (b), although the errors are also manifest in the point-to-point fluctuations in the data along Qz.

